# Set the path to the simulation setup file
cwd = os.path.abspath('..')
session_path = os.path.join(cwd, 'SIMsalabim','ZimT')
zimt_device_parameters = os.path.join(session_path, 'simulation_setup.txt')
# Set the JV sweep simulation parameters
scan_speed = 10
direction = 1
G_frac = 1
tVG_name = os.path.join(session_path,'tVG.txt')
Vmin = 0.0
Vmax = 1.25
steps = 100
# Run the JV sweep simulation
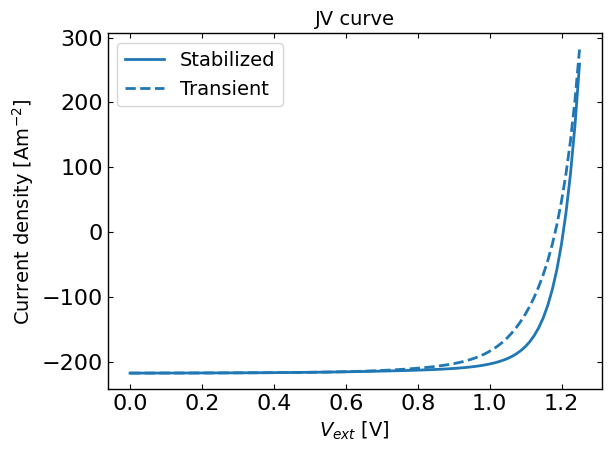
# Note: JV sweep simulations are different from the run_SS_JV simulations. JV_sweep by default runs a transient simulation (i.e. using zimt) to get the JV curve, while run_SS_JV runs a steady-state simulation (i.e. using simss) to get the JV curve.
# you can also run the steady-state JV using JV_sweep by setting stabilized=True
# stabilized run
ret, mess, rms = JV_sweep(zimt_device_parameters, session_path, 0, scan_speed, direction, G_frac, tVG_name, run_mode=False, Vmin=Vmin, Vmax=Vmax, steps = steps, expJV_Vmin_Vmax='', expJV_Vmax_Vmin='',rms_mode='lin',threadsafe=False, stabilized=True,tj_name=os.path.join(session_path,'tj_stabilized.txt'))
# transient run
ret, mess, rms = JV_sweep(zimt_device_parameters, session_path, 0, scan_speed, direction, G_frac, tVG_name, run_mode=False, Vmin=Vmin, Vmax=Vmax, steps = steps, expJV_Vmin_Vmax='', expJV_Vmax_Vmin='',rms_mode='lin',threadsafe=False, stabilized=False,tj_name=os.path.join(session_path,'tj_transient.txt'))